Archives Extra Glossary Earnings
April 13, 2026 (Monday)
The Morning Briefing

1The 7-session winning streak ended Friday. The S&P 500 slipped -0.11% to 6,816.89, while the Dow fell -0.56%. NASDAQ (+0.35%) was lifted by TSMC's strong results. Weekly, the S&P gained +3.56%, the best week since May 2025. The UMich Consumer SentimentConsumer Sentiment IndexMonthly survey by the University of Michigan gauging economic outlook. Above 100 = optimism; below 50 = severe pessimism. plunged to a record-low 47.6, while March CPICPI (Consumer Price Index)Key inflation gauge from the Bureau of Labor Statistics, central to Fed policy decisions. surged +0.9% MoM. Core CPI at +0.2% beat estimates, keeping equities relatively calm.

2By sector, Semis (SMH +1.5%) led on TSMC's 35% revenue surge. Energy (XLE +1.1%) rose on oil uncertainty. Financials (XLF -0.9%) were dragged by FICO -13.5%, Healthcare (XLV -1.3%) lagged on defensive outflows. CoreWeave surged +11% on its Anthropic deal; ServiceNow (-6%) and Snowflake (-10%) tumbled on AI agent disruption fears.

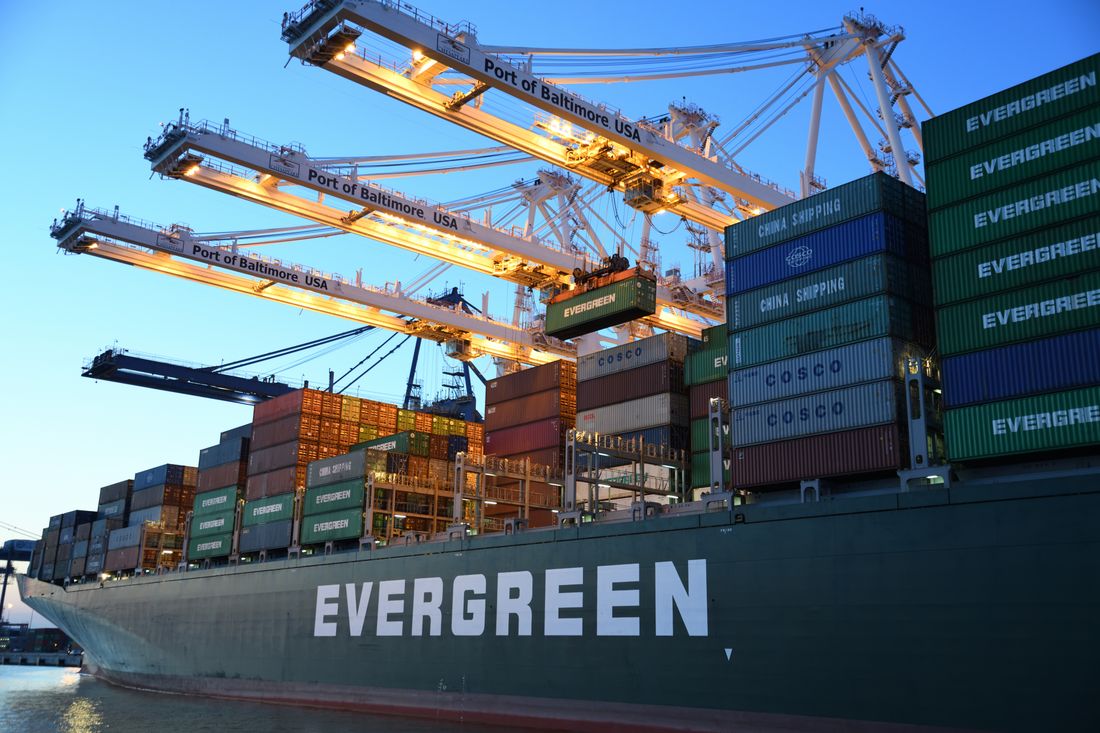
3⚠️ 🔴 BREAKING: On April 12, US-Iran peace talks in Islamabad collapsed. Trump immediately ordered a naval blockade of the Strait of HormuzStrait of HormuzNarrow waterway between Iran and Oman carrying ~20% of global seaborne oil. A blockade would severely disrupt energy supplies.. The US Navy will block all ships to/from Iranian ports and seize vessels that paid Iran tolls (up to $2M/ship, some in yuan). CENTCOM begins enforcement today April 13 at 10:00 AM ET. Concurrent mine-clearing operations will proceed. Non-Iran-bound vessels may pass freely, but escalation risks for oil, global economy, and US-China relations are significant.

📊 Sector Performance (Apr 10 Close)
Semis SMH +1.5%
Energy XLE +1.1%
Comm Svcs XLC +0.4%
Cons Disc XLY +0.2%
Tech XLK +0.1%
Materials XLB -0.1%
Staples XLP -0.3%
Industrials XLI -0.5%
Utilities XLU -0.6%
Real Est XLRE -0.8%
Financials XLF -0.9%
Healthcare XLV -1.3%
S&P 500 6,816.89 -0.11%
NASDAQ 22,902.90 +0.35%
Dow 47,916.57 -0.56%
Russell 2000 2,630.59 -0.22%
VIXVIX (Volatility Index)An index measuring expected S&P 500 options volatility. Below 20 = calm, 20-30 = caution, above 30 = fear, above 40 = panic. 19.49 -7.4%
10Y UST 4.31% +6bp
USD/JPY 159.13 +0.21%
WTI $95.90 -3.96%
Gold $4,780 +0.99%
BTC $72,139 +1.45%
37/100
🟡 Caution
8-Indicator Composite — Caution Zone (31–50)
As of: April 10 close | Prev: 35 → 37 (+2pt ↑ slight deterioration)
⚠️ Silent Crisis (VIX 19.49 < 20 & SKEW ~150 > 135)★★★★★
📊 Show 8-Indicator Breakdown (click to toggle)
VIXVIX (Fear Index)S&P 500 options implied volatility index. Above 20 signals caution; above 30 signals fear. (Fear Index)
19.49
28
SKEWSKEW IndexA CBOE tail risk indicator reflecting demand for S&P 500 out-of-the-money put options. Above 130 signals caution; above 140 indicates elevated tail risk. Low VIX + high SKEW = "silent crisis" signal. (Tail Risk)
~150 (adjusted)
97
Yield CurveYield Curve (10Y-2Y Spread)The 10-year US Treasury yield minus the 2-year yield. Positive is normal; negative (inverted) signals potential recession. (10Y-2Y)
+0.50%
28
10Y Yield
4.31%
42
EPSEPS (Earnings Per Share)A company's net income divided by shares outstanding. "EPS Revisions" refers to upward/downward changes in analysts' EPS estimates. Revisions
Flat
45
Fear & GreedFear & Greed IndexA CNN market sentiment index (0-100). 0-25 = "Extreme Fear," 75-100 = "Extreme Greed." Used as a contrarian indicator.
~28
42
SPXA50RSPXA50R (S&P 500 % Above 50-Day MA)The percentage of S&P 500 stocks trading above their 50-day moving average. Below 30% signals a selloff; above 70% signals overheating. (Breadth)
~58%
18
200D MA Deviation
+3.41%
22
Friday's closing VIX at 19.49 fell below 20, appearing calm on the surface. However, the SKEW index remains elevated around 150, triggering a new "Silent Crisis" signal. Low VIX (market complacency) combined with high SKEW (heavy tail-risk hedging demand) indicates that institutional investors were bracing for "invisible risk." This weekend, that "invisible risk" materialized. Following the collapse of Islamabad peace talks, President Trump ordered a naval blockade of the Strait of Hormuz. Enforcement begins today at 10:00 AM ET, and VIX is expected to surge sharply at the open. With oil likely exceeding $100 and geopolitical risk reigniting, the next issue's risk score is projected to rise into the Warning Zone (51–68). SPXA50R had recovered to 58%, but market breadth risks contracting again under the blockade's impact.
🔴 BREAKING
Naval warship at sea
Photo: Pexels
GEOPOLITICS

US Orders Naval Blockade of Strait of Hormuz — Ships Paying Iran Tolls to Be Seized, Enforcement Begins Today 10:00 ET

Following the collapse of peace talks in Islamabad, President Trump on April 12 ordered a US Navy Strait of HormuzStrait of HormuzNarrow waterway between Iran and Oman carrying ~20% of global seaborne oil. A blockade would severely disrupt energy supplies. naval blockade. Since hostilities began in late February, Iran had effectively closed the strait while allowing some vessels to pass for tolls of up to $2M/ship (some paid in yuan). Trump declared that "all vessels that paid illegal tolls to Iran will be searched and seized in international waters," warning that "those who paid tolls are not guaranteed safe passage." CENTCOM announced it will "impartially" enforce the blockade on ships entering/leaving Iranian ports starting today, April 13, 10:00 AM ET, with concurrent mine-clearing operations. Non-Iran-bound vessels may transit freely, but escalation with China, India, and other nations that have been paying tolls to import Iranian oil is inevitable. The blockade of a chokepoint carrying 20% of global oil shipments poses compounding risks: an oil price spike, global economic fallout, and deteriorating US-China relations.

💡
Why it matters: The US naval blockade of Hormuz is the largest maritime blockade since WWII. The ceasefire-to-talks-collapse-to-blockade escalation makes scenarios of oil above $100, CPI re-acceleration, and Fed rate-cut postponement increasingly realistic. Markets will open this week on extreme alert.
TOP STORY
Business person checking economic news
Photo: Pexels
ECONOMY

US Consumer Sentiment Hits All-Time Low — UMich Index at 47.6, Worst in 70+ Years of Survey History

The University of Michigan's consumer sentiment index (preliminary) released April 10 plunged 11% from the prior month to 47.6, the lowest reading since the survey began in 1952. This marks a historic collapse, falling below the Biden-era inflation peak (50) and the Great Recession trough. Survey director Joanne Hsu noted that "confidence declined across all demographic groups regardless of age, income, or political affiliation." The primary drivers are anxiety over the Iran war and surging gasoline prices, with 1-year inflation expectationsInflation ExpectationsThe future inflation rate anticipated by consumers and market participants. The Fed closely monitors whether expectations remain "anchored"; a sharp rise can become a self-fulfilling prophecy. jumping a full percentage point from 3.8% to 4.8%. The same-day March CPI confirming a 21.2% gasoline price surge further eroded confidence. However, the immediate equity market impact was limited, with many analysts viewing sentiment as "a lagging indicator of behavior." The key question is whether this psychological deterioration will translate into actual consumer spending cuts.
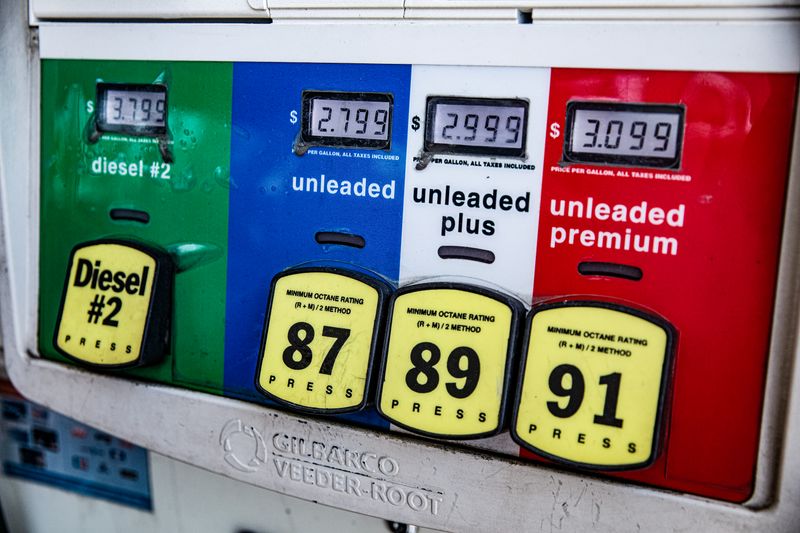
💡
Why it matters: The historic low in consumer sentiment signals risk of a slowdown in personal consumption, which accounts for ~70% of US GDP. Q2 retail data will be the critical test of whether the "sentiment-to-behavior" transmission materializes.
Gas station fuel pump Photo: Pexels
ECONOMY BLS / CNBC / Fox Business
March CPI Surges +0.9% MoM on Energy Shock — Gasoline +21.2%, But Core Holds Steady
March CPI surged +0.9% MoM and +3.3% YoY, sharply accelerating from February's +0.3%/+2.4%. The culprit was energy, with gasoline spiking +21.2%, accounting for nearly three-quarters of the total increase. The Iran war's de facto closure of the Strait of Hormuz pushed crude near $100. However, core CPICore CPICPI excluding food and energy. Strips out volatile components to gauge underlying inflation trends. A key metric for the Fed. (ex-food & energy) came in at +0.2% MoM and +2.6% YoY, beating estimates by 0.1pp each — a "two-faced CPI" showing suppressed underlying inflation. Markets welcomed the core stability, avoiding a panic selloff.
💡
Why it matters: Headline 3.3% is alarming, but the Fed-focused core at 2.6% is improving. Markets are betting the energy shock is "transitory," but if the ceasefire collapses, that premise shatters.
Data center server racks Photo: Pexels
TECH CNBC / Bloomberg / 247 Wall St
CoreWeave Soars 11% on Multi-Year Anthropic Deal — AI Cloud Dominance After $21B Meta Win
AI-focused cloud provider CoreWeave (CRWV) announced a multi-year cloud infrastructure deal with Anthropic, sending shares up +11%. CoreWeave's Nvidia GPUGPU (Graphics Processing Unit)Hardware essential for AI/ML training and inference. Nvidia's H100/B200 series dominates the market.-powered data centers will support Anthropic's "Claude" AI model development and operations. Coming just a day after Meta committed an additional $21B, CoreWeave secured two mega-deals in 48 hours. This means 9 of the top 10 AI model providers now use CoreWeave's platform. The string of contract wins has silenced post-IPOIPO (Initial Public Offering)A company's first sale of stock to the public, raising capital and providing liquidity. skeptics and underscores the breadth of AI infrastructure demand.
💡
Why it matters: AI infra demand is expanding downstream from "Nvidia GPUs to CoreWeave's Cloud." The investment theme is broadening beyond AI chips to cloud infrastructure players.
Microchip close-up Photo: Pexels
EARNINGS CNBC / Quartz / tbreak
TSMC Q1 Revenue $35.7B, +35% YoY — AI Chip Demand Drives Record, Hits Top of Guidance
The world's largest contract chipmaker TSMC reported Q1 2026 revenue of NT$1.134T (~$35.71B), up +35% YoY, beating analyst estimates and hitting the top of its January guidance range ($34.6B–$35.8B). Sustained demand from Apple and Nvidia, plus advanced node price hikes, boosted results. Memory shortages weighed on smartphone/PC orders, but AI-related bookings more than offset the decline. Taipei-listed shares rose +2.3%, up +29% YTD. The April 16 full earnings report will focus on confirming the record-high gross margin guidance of 63–65%.
💡
Why it matters: TSMC earnings are the ultimate "health check" on the AI chip cycle. +35% revenue growth is the most compelling proof that AI investment momentum remains intact.
Programming code on screen Photo: Pexels
TECH UBS / CNBC / Seeking Alpha
UBS Downgrades ServiceNow — "AI Agents Are a Bigger SaaSSaaS (Software as a Service)Cloud-delivered software with subscription pricing. Salesforce, ServiceNow, etc. are representative examples. Threat Than Expected"
UBS downgraded ServiceNow (NOW) from Buy to Neutral, slashing its price target 40% from $170 to $100. Shares fell -6%, now down -45% YTD. UBS analysts warned that "autonomous AI agents fundamentally threaten the traditional SaaS per-seat pricing model." Over half of enterprise customers are reportedly considering cuts to core software spending, accelerating the shift toward AI infrastructure. The cRPO growth outlook was revised down from 20% to 16%. Selling pressure spread across enterprise software names including CRM, INTU, and ADEE.
💡
Why it matters: The structural disruption risk for SaaS is materializing. AI isn't just replacing human workers — it's replacing the software those workers use, a new paradigm shift.
Engineer working in server room Photo: Pexels
TECH Yahoo Finance / FX Leaders / StockStory
Snowflake Plunges 10% as AI Disruption Fears Hit SaaS — Anthropic Managed Agents Trigger Selloff
Snowflake (SNOW) plunged -10.2%. Anthropic's Managed Agents announcement demonstrated the ability to execute complex tasks without human operators, shaking the foundational assumptions of traditional SaaS consumption models. Snowflake's consumption-based pricing depends on active user interaction — a premise that AI agent automation upends. A class-action lawsuit over insufficient Iceberg Tables and Fuel efficiency disclosures added further pressure. The stock is approaching its 52-week low, becoming emblematic of the broader "AI re-evaluation" across enterprise software.
💡
Why it matters: The sorting of AI-era winners and losers is accelerating. The line between "companies that benefit from AI" and "companies replaced by AI" is now being drawn within the software sector itself.
Credit cards Photo: Pexels
ECONOMY Barclays / TradingKey / StockTwits
FICO Crashes 13.5% as GSEs Embrace VantageScore 4.0, Breaking Monopoly
Fair Isaac (FICO) plunged -13.5%. The GSEs (Fannie Mae & Freddie Mac) formally adopted VantageScore 4.0 as an alternative credit score, introducing the first real competitive pressure on FICO's monopoly in the mortgage market. Backlash over FICO's doubling of mortgage score prices to $10 in early 2026 intensified the reaction, with Senator Hawley's formal investigation into pricing practices underway. Barclays cut its price target, followed by cautious pivots from Goldman Sachs, UBS, and Baird. The US mortgage market is a ~$2T/year industry, and the GSEs' adoption of a competing score signals a fundamental structural shift.
💡
Why it matters: FICO scores were de facto mandatory for all mortgages, but the GSEs' adoption of a competing score marks the beginning of monopoly erosion. Loss of pricing power threatens the long-term revenue structure.
💡 KEYWORD

Consumer Sentiment Index — How Psychology Drives the Economy

The Consumer Sentiment Index quantifies how ordinary consumers feel about current economic conditions and future prospects. The most historically significant and influential is the University of Michigan Consumer Sentiment Index, which has surveyed approximately 600 households by phone each month since 1952, asking about "current living conditions" and "future economic outlook" on a 5-point scale. Above 100 indicates optimism; below 50 signals severe pessimism.

The other major gauge is the Conference Board Consumer Confidence Index, which surveys about 3,000 households with a heavier emphasis on employment conditions. While the two measures correlate, the Michigan index is more sensitive to gasoline prices and inflation expectations, whereas the Conference Board index responds more to labor market shifts.

Historically, a sharp drop in consumer sentiment does not necessarily lead to recession. In June 2022, surging gasoline prices pushed the Michigan index to 50, yet the real economy remained resilient. However, prolonged pessimism risks triggering a "self-fulfilling recession" spiral: anxiety leads to spending cuts, which hurts corporate earnings, which triggers layoffs, which deepens anxiety further.

📊 Investor Perspective
Consumer sentiment is "soft data" (psychological) and does not necessarily lead "hard data" (actual spending and employment). As the 2022 experience shows, depressed sentiment and robust consumer spending can coexist for extended periods. But if the divergence persists long enough, convergence is inevitable.
🔗 Market Relevance: The UMich index of 47.6 released April 10 is the all-time low in 70+ years of survey history. The Iran war and gasoline price surge are the direct causes, but the broad-based decline across all demographics suggests structural pessimism beyond mere fuel anxiety. Investors are focused on the speed of "sentiment-to-spending" transmission. Unemployment remains low and equities posted strong weekly gains, but if consumer psychology stays this depressed, Q2 retail sales could show a clear impact.
🔍 EDITORIAL

The "Two-Faced CPI" and the Market's Bet — Is the Energy Shock Transitory or Structural?

March CPI was like a coin with two faces.

The front face is shocking. Headline CPI surged +0.9% MoM and +3.3% YoY, leaping from 2.4% just a month earlier to the highest level in two years. The culprit is clear — a 21.2% gasoline price surge. The Iran war's de facto closure of the Strait of Hormuz cut off 20% of global oil shipments, pushing overall energy prices up 10.9%.

The reverse face is surprisingly mild. Core CPI (excluding food and energy) came in at +0.2% MoM and +2.6% YoY, beating estimates by 0.1pp each. "Sticky" categories like shelter, medical care, and used cars remained stable.

The market chose to believe the reverse face. Friday's S&P 500 fell just -0.11%, with no panic. The logic is straightforward — the FedFederal Reserve (Fed)The US central bank. Manages monetary policy (interest rates, QE/QT) to achieve price stability and maximum employment. Chair: Jerome Powell. focuses on core, and the energy shock is transitory, destined to fade with a ceasefire.

But this bet rests on two assumptions.

First, the ceasefire must hold. Yet weekend peace talks in Islamabad collapsed. VP Vance walked out after Iran refused to halt uranium enrichment, and Trump ordered a Hormuz Strait "blockade." With the two-week ceasefire deadline approaching, if oil prices breach $100 again, April CPI will be affected.

Second, consumer psychology must not spill into the real economy. Yet the UMich index at a historic low of 47.6 shows consumers do not view this as "transitory." The 1-year inflation expectations surge to 4.8% is particularly alarming — an "unanchoring" of inflation expectations is one of the Fed's most feared scenarios.

Scenarios for the week ahead. If Tuesday's PPI (March) shows energy-driven upside similar to CPI, the "two-faced inflation" thesis will be confirmed. Thursday's Netflix earnings will serve as a barometer for discretionary consumer spending. Above all, the fate of the ceasefire extension is the biggest variable.

The market's "core stability" scenario is rational but fragile. A macro storm alongside micro calm — which way this divergence resolves will determine the direction of Q2 markets.

* This editorial reflects the views of the Atlas editorial team and does not constitute a recommendation to buy or sell any financial product.
4/13Mon
10:00 ET 🇺🇸 MID
Existing Home Sales (March)
Leading indicator for housing market
4/14Tue
08:30 ET 🇺🇸 HIGH
PPI (March) — Producer Price Index
Key inflation data following CPI. Watch for energy-driven overshoot
06:00 ET 🇺🇸 MID
NFIB Small Business Optimism Index (March)
Small business sentiment gauge
21:00 UTC 🇪🇺 MID
ECB President Lagarde Speech
Direction of European monetary policy
🇺🇸 HIGH
JPM / C / WFC / JNJ / BLK Q1 Earnings
Major banks + healthcare + asset mgmt — earnings season kicks off
4/15Wed
🇺🇸 HIGH
MS / BAC / PNC Q1 Earnings
Financials round 2
4/16Thu
08:30 ET 🇺🇸 HIGH
Philadelphia Fed Manufacturing Index (April)
Est. 3.3 (prev. 18.1). A sharp drop would signal manufacturing weakness
08:30 ET 🇺🇸 MID
Initial Jobless Claims
High-frequency labor market barometer
🇺🇸 HIGH
NFLX / TSM / ABT / PEP / SCHW Q1 Earnings
TSMC full earnings + Netflix — AI demand & consumer discretionary check
4/17Fri
08:30 ET 🇺🇸 MID
Housing Starts (March)
Leading indicator for the construction sector
Monday 4/13 (BMO)
GS
Goldman Sachs
Financials
EPS Est: $16.41 / Rev Est: $17.0B
IPO cycle + strong trading
Tuesday 4/14 (BMO)
JPM
JPMorgan Chase
Financials
Core big bank earnings
NII trends / credit losses
WFC
Wells Fargo
Financials
Mortgage trends
Impact of FICO competition
C
Citigroup
Financials
Restructuring benefits
Global business portfolio selection
BLK
BlackRock
Asset Management
AUM trends
ETF fund flows
Wednesday 4/15 (BMO)
BAC
Bank of America
Financials
NII improvement expected
Consumer lending trends
MS
Morgan Stanley
Financials
Wealth management
M&A advisory revenue
Thursday 4/16
NFLX
Netflix
Entertainment
AMC (after close)
Consumer discretionary spending barometer
TSM
TSMC (Full Earnings)
Semiconductors
63-65% gross margin guidance confirmation
Most critical AI semiconductor cycle event
PEP
PepsiCo
Consumer Staples
BMO
Consumer price sensitivity

This article is AI-generated. Accuracy is not guaranteed. For informational purposes only; not investment advice.

Portal