Archive Special Editions Glossary Earnings Analysis
April 16, 2026 (Thursday)
The Morning Briefing
Atlas Morning Brief
April 16, 2026 (Thursday)
Loading…
0:00-11:13
SPEED

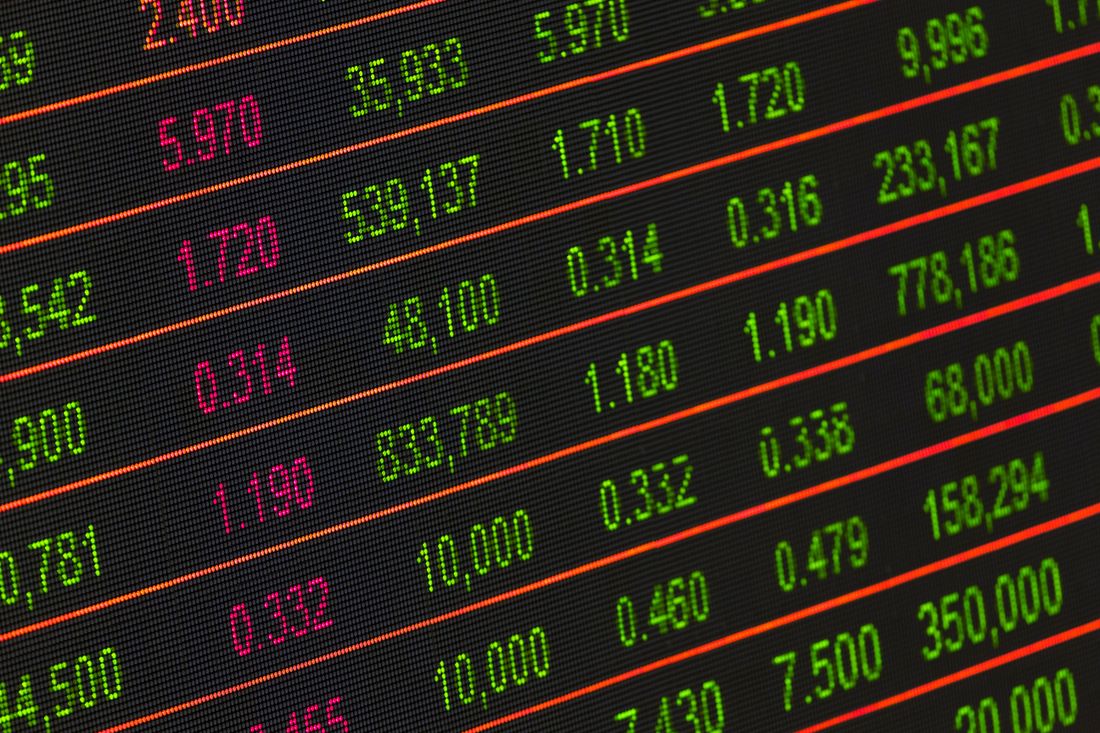
1The S&P 500 closed above 7,000 for the first time in history, with the Nasdaq clearing 24,000 to log a fresh record. The S&P 500 finished at 7,022.95 (+0.80%), marking the first-ever close above the 7,000 threshold. The Nasdaq Composite ended at 24,016.02 (+1.59%), its 11th straight advance and closing in on the longest run since 2021. The Dow bucked the trend at 48,463.72 (-0.15%), weighed down by a -5% drop in Caterpillar.

2Bank earnings broadly surprised to the upside, lifting the entire financial sector. Morgan Stanley's quarterly revenue topped $20B for the first time ever at $20.6B, with EPS of $3.43 far exceeding the $3.02 consensus, sending shares up more than +5%. Bank of America also beat with EPS of $1.11 vs $1.00 expected, and net income of $8.6B hit its highest level in roughly two decades. A sharp rebound in investment banking and trading revenue was the common theme.

3Progress on Iran peace talks and Tesla's AI5 chip announcement further boosted investor sentiment. President Trump said "the Iran war is close to over," and Pakistan-mediated second-round peace talks are expected to resume within days, keeping crude oil prices stable. Tesla announced the tape-out of its AI5 chipAI5 Chip Tape-Out"Tape-out" refers to the stage at which semiconductor design is finalized and the project enters manufacturing. Tesla's next-generation AI inference chip "AI5" is designed in-house, delivering 8–10x the compute performance of HW4, 192GB of memory (9x), and 5x the memory bandwidth. Volume production is slated for mid-to-late 2027 for Optimus and supercomputer applications., sending shares up +8%, while Nvidia extended its winning streak to 11 sessions with another record. The SEC also scrapped its day-trading rule (the PDTPDT (Pattern Day Trader Rule)An SEC rule for retail investors. Accounts executing four or more day trades within five business days previously required a $25,000 minimum maintenance margin. After 25 years, the rule was abolished on April 14, 2026, lowering the entry threshold to a $2,000 minimum account balance. $25,000 requirement), sending Robinhood shares up +10% as one of several idiosyncratic catalysts.

Sector Performance (April 15, 2026 close)
Semiconductors SMH +2.80%
Technology XLK +2.10%
Consumer Discretionary XLY +1.60%
Communication Services XLC +1.20%
Financials XLF +0.50%
Health Care XLV +0.10%
Materials XLB -0.10%
Real Estate XLRE -0.20%
Utilities XLU -0.30%
Consumer Staples XLP -0.40%
Energy XLE -0.60%
Industrials XLI -1.10%
S&P 500 7,022.95 +0.80%
NASDAQ 24,016.02 +1.59%
Dow 48,463.72 -0.15%
Russell 2000 2,512.40 +0.95%
VIXVIX (Volatility Index)A measure of expected volatility on S&P 500 options. Readings below 20 indicate calm, 20–30 caution, above 30 fear, and above 40 panic. 18.36 -2.5%
US 10Y 4.12% -3bp
USD/JPY 158.45 -0.10%
WTI $90.92 -0.40%
Gold $4,820 +0.80%
BTC $74,200 -2.40%
36/100
Caution Zone
Composite of 8 indicators — Caution Zone (31–50)
As of: April 15, 2026 close | vs previous issue (4/14→4/15): 30 → 36 (+6pt ↑ Deterioration)
🔔 "Silent Distress" signal triggered ★★★★★ VIX<20 and SKEW>135
View 8-indicator breakdown (Click to expand)
VIXVIX (Fear Gauge)A measure of expected volatility on S&P 500 options. Above 20 indicates caution, above 30 indicates fear. (Fear Gauge)
18.36
28
SKEWSKEW IndexA CBOE tail-risk gauge reflecting demand for out-of-the-money S&P 500 put options. 100 is neutral, above 130 signals caution, and above 140 signals elevated tail risk. (Tail Risk)
145
78
Yield CurveYield Curve (10Y-2Y Spread)The 10-year Treasury yield minus the 2-year yield. Positive readings are normal (long > short rates); negative readings indicate inversion, often considered a recession precursor. (10Y-2Y)
+0.45%
28
10Y Treasury Yield
4.12%
42
EPSEPS (Earnings Per Share)A company's net income divided by shares outstanding — the key profitability metric on a per-share basis. "EPS revisions" refer to analysts' upward or downward adjustments to EPS forecasts. Revisions
Slightly upward
20
Fear & GreedFear & Greed IndexA CNN-calculated market sentiment index (0–100). 0–25 is "Extreme Fear," 25–45 "Fear," 45–55 "Neutral," 55–75 "Greed," and 75–100 "Extreme Greed." Often used as a contrarian indicator.
72
40
SPXA50R (Breadth)
76%
55
200-Day MA Deviation
+9.5%
38
Several indicators show modest shifts. The VIX sits at a calm 18.36, but the SKEW Index remains elevated at 145, triggering a "Silent Distress" signal. Historically, rising tail-risk premiums during record-setting rallies have at times preceded sharp corrections, warranting caution. This is a phase to be measured about adding large new positions and to emphasize diversification and hedging.
TOP STORY
Stock exchange ticker board
Photo: Pexels
ECONOMY

S&P 500 Tops 7,000 for the First Time — Record Run Fueled by Iran Peace Progress and Bank Earnings Beats

On April 15, the S&P 500 closed at 7,022.95 (+0.80% d/d), marking the first-ever close above 7,000. The Nasdaq Composite also notched a fresh high of 24,016.02 (+1.59%), extending its winning streak to 11 sessions and closing in on the longest run since 2021. The index has rebounded more than +11% in roughly two weeks from the late-March Iran-war lows, with investor sentiment dramatically improved. President Trump said "the Iran war is close to over," and Pakistan-mediated second-round peace talks are expected to resume within days. Both Morgan Stanley and Bank of America beat earnings, with a sharp rebound in investment banking and trading revenue lifting the entire financial sector. Tesla surged +8% after announcing the tape-out of its AI5 chip, and Nvidia extended its winning streak to 11 sessions on AI infrastructure investment optimism. Three tailwinds — receding geopolitical risk, bank earnings strength, and accelerating AI semiconductor cycle — fired in unison.

Why it matters: The S&P 500's closing break above the psychological 7,000 level suggests that the tariff- and geopolitics-driven pressure in place since late 2025 has cycled through, potentially marking the start of a new AI- and financials-led cycle. That said, the SKEW Index remains elevated, warranting attention to the coexistence of a "momentum-driven rally" and heightened "tail-risk caution."
Business meeting Photo: Pexels
EARNINGS CNBC / Bloomberg
Morgan Stanley Tops $20B in Quarterly Revenue for the First Time — Equity Trading Revenue Highest in 15 Years
Morgan Stanley reported Q1 2026 earnings on April 15. Total revenue reached $20.6B, clearing the $20B mark for the first time, while EPS of $3.43 far exceeded the $3.02 consensus. Equity trading revenue rose 25% to $5.15B, the highest in 15 years, and investment banking revenue surged 36%. Wealth management also hit a record, up 16% to $8.52B. ROTCEROTCE (Return on Tangible Common Equity)Net income as a percentage of tangible common equity (excluding goodwill and intangibles). A gauge of a bank's core profitability; 15–20% is considered strong for major US banks. of 27.1% and a CET1CET1 (Common Equity Tier 1 Ratio)The ratio of core capital (common equity, retained earnings, etc.) to risk-weighted assets. Basel III requires a minimum of 4.5% (10%+ including buffers). US large banks typically run at 13–15%. ratio of 15.1% underscored the firm's strong capital efficiency. Shares rose more than +5%.
Why it matters: Clearing $20B in revenue is a historic first for the firm. The simultaneous acceleration of IB, trading, and WM points to broad strength across Wall Street.
Bank office Photo: Pexels
EARNINGS CNBC / GuruFocus
Bank of America Q1 Net Income $8.6B, Highest in Roughly Two Decades — Equity Trading +30%
BAC reported EPS of $1.11 (vs $1.00 expected), revenue of $30.43B (vs $29.93B expected), and net income of $8.6B (+17% YoY) — the highest in several quarters. Equity trading rose +30% to $2.83B, beating StreetAccount by $350M, and investment banking was up +21% to $1.8B. Fixed-income trading, however, missed consensus by $330M. Shares rose +2.5%.
Why it matters: Like MS, BAC showed a dual-engine recovery in IB and equity trading. The roughly two-decade-high net income suggests a broader structural shift across the banking sector.
Chip circuitry Photo: Pexels
TECH TrendForce / Teslarati
Tesla Completes AI5 Chip Tape-Out, Musk Claims "H100-Class Performance" — Shares Surge +8%
Tesla CEO Elon Musk announced on April 15 the tape-out (design completion and production readiness) of its next-generation AI inference chip "AI5." Versus HW4, it delivers 8–10x compute performance, 192GB LPDDR5X memory (9x), and 5x memory bandwidth. Musk claimed "a single AI5 chip is equivalent to an Nvidia H100." Volume production is slated for mid-to-late 2027, targeting Optimus and supercomputer applications. Shares jumped +8% as Tesla entered a sharp two-week rebound.
Why it matters: Tesla's in-house AI silicon strategy is becoming concrete. It signals a path away from Nvidia dependence and toward commercializing robotics, potentially accelerating diversification in the AI semiconductor cycle.
Mobile trading Photo: Pexels
POLICY Yahoo Finance / Benzinga
SEC Scraps $25,000 Day-Trading Rule — Robinhood Shares +10%, Market Cap Gains $7B in a Day
On April 14, the SEC abolished the Pattern Day Trader (PDT) rule after more than 25 years. Previously, accounts executing four or more day trades within five business days required a $25,000 minimum maintenance margin. The new framework shifts to a model calibrated to actual intraday exposure. With the minimum account balance now $2,000, the entry barrier for small retail traders drops sharply. Robinhood surged +10% and Webull rose more than +9%, concentrating idiosyncratic demand expectations across brokers.
Why it matters: Expectations for commission and balance growth at retail brokers are ratcheting higher. Accelerating retail participation in H2 2026 could become a structural driver of volatility in tech and small caps.
Semiconductor wafer Photo: Pexels
EARNINGS CNBC / ASML
ASML Q1 Revenue Tops Expectations at €8.8B — 2026 Full-Year Guidance Raised to €36–40B
Dutch lithography equipment leader ASML reported Q1 2026 earnings on April 15. Revenue reached €8.8B (vs €8.5B expected) and net income €2.8B (vs €2.5B expected), topping market forecasts. Gross margin of 53.0% came in at the top of guidance. ASML raised its 2026 full-year revenue outlook from €34B to €36–40B. Despite headwinds from tighter China regulations, strong demand for EUV lithography equipment for AI applications is driving the overall outlook, further raising expectations for TSMC's earnings on April 16.
Why it matters: Upstream in the AI semiconductor cycle (lithography) significantly raised full-year guidance — a leading confirmation of downstream demand strength at TSMC, Nvidia, and others.
Federal Reserve Photo: Pexels
POLICY Federal Reserve / Bloomberg
Fed Beige BookBeige BookA district-level report on the US economy published by the Fed eight times a year. It summarizes firsthand business and economic contacts gathered by the 12 regional Fed banks and is released about two weeks ahead of each FOMC meeting. The name comes from its beige cover. — US Economy Expanding "Modestly," But Iran-War Uncertainty Adds New Drag
According to the Beige Book released by the Federal Reserve on April 15, economic activity continued to expand "slightly to modestly" in 8 of 12 districts, while 3 districts reported flat conditions and 1 saw a modest contraction. Higher energy costs from the Iran war are weighing on low- and middle-income households, with the report flagging a surge in demand for assistance as utility bills outpace incomes. Some districts also reported signs of labor-market softening (rising applicant counts). The report added to the case for a further rate cut at the May FOMC.
Why it matters: The "modest expansion" continues, but "Iran-war uncertainty" is now explicitly identified as a new headwind. Evidence is accumulating in favor of a rate cut at the May FOMC.
ATLAS EDITORIAL

Behind the S&P 500's Break Above 7,000 — AI Earnings Season vs Residual Geopolitical Risk

Reading a phase where a historic milestone and a "Silent Distress" signal coexist

At the onset of the Iran war in late March, the S&P 500 plunged to around 6,250. In roughly two weeks it staged a +11% rebound, closing above 7,000 for the first time. Three structural shifts underpin this record.

The first is the quality of bank earnings. Morgan Stanley and BAC both beat expectations with a dual-engine of trading and investment banking, showing that "the financial sector has cleared the H2 2025 tariff downturn." The +36%/+21% surge in IB revenue in particular signals a revival of the M&A and ECM cycle, which had been in a long winter since 2022. With April 17 (Good Friday) closed, the focus shifts to next week's earnings from GS, WFC, and C, and whether the sector as a whole gets re-rated.

The second is the accelerator on the AI semiconductor cycle. Tesla surged +8% on its AI5 tape-out, while Nvidia set another record on its 11th straight gain amid AI infrastructure investment expectations. ASML raised its full-year guidance by €2–6B to €36–40B. If TSMC's Q1 revenue on April 16 clears the midpoint of the $34.6–35.8B range (+38% YoY), it would be powerful evidence that deflects and defers the H2 2026 AI-semiconductor peak thesis.

The third is the lingering geopolitical shadow. While President Trump says Iran peace is "close to over," the US Navy's blockade of Iranian ports continues, and the Pakistan-mediated second round of talks has yet to materialize. Crude is holding in the $90s, and the Fed Beige Book emphasized hardship among low-income households. A SKEW reading of 145 is a textbook "Silent Distress" pattern — tail hedges being built up during record-setting rallies. The market is not uniformly optimistic; composite progress and resistance are running side-by-side.

Editorial view: Over the next few sessions — with TSMC, Netflix, and UnitedHealth earnings on April 16, and major US bank earnings plus the second round of Iran talks ahead — we'll learn whether this record is a "genuine breakout" or a "classic expectation-driven move." We see the next three sessions as a phase for "status checks" rather than "adding to longs."

*This article does not constitute a recommendation to buy or sell any specific security. Investment decisions are your own responsibility.

Silent Distress
Silent Distress / SKEW > 135, VIX < 20
Where the VIX measures fear at current levels, the SKEW Index measures hedging demand for out-of-the-money puts on S&P 500 options. A regime where SKEW exceeds 135 while VIX is below 20 reflects a contradictory state: "calm on the surface, yet institutional investors are quietly accumulating tail-risk hedges beneath it."
Historical precedent
The "Silent Distress" signal was triggered in January 2018 (just before February's Volmageddon), February 2020 (just before the COVID crash), and January 2022 (just before the early-year decline).
Market mechanism
Large investors tend to load up on insurance when the VIX is low and put-option hedging is cheap. This pushes SKEW higher while leaving VIX depressed. The divergence between surface-level stability and underlying hedging demand is the essence of "Silent Distress."
Investment implications
On its own, it is not a sell signal, but the combination of "momentum-driven rally + elevated SKEW" has in past analogues preceded 5–10% pullbacks within 2–4 weeks. This is a phase to emphasize position-tail management (reducing leverage, considering protective puts).
Today's relevance
Today's SKEW is estimated at 145 with VIX at 18.36 — a textbook "Silent Distress" trigger. The Atlas Risk Meter has flagged the same signal at ★★★★★.
Today's relevance Behind the historic first close above 7,000 on the S&P 500, the SKEW Index remains elevated at 145. The Atlas Risk Meter detects this "Silent Distress" signal at ★★★★★. The divergence between surface euphoria and below-the-surface hedging demand has been common to past major correction phases. This is a phase to be measured about adding large new long exposure and to emphasize hedging existing positions.
Learn more in the Glossary →
4/16Thu
08:30 ET 🇺🇸 HIGH
Retail Sales (March)
Litmus test for consumer trends
08:30 ET 🇺🇸 HIGH
Initial Jobless Claims
Weekly labor-market gauge
08:30 ET 🇺🇸 MID
Philadelphia Fed Manufacturing Index (April)
Mid-Atlantic regional activity
09:15 ET 🇺🇸 MID
Industrial Production / Capacity Utilization (March)
Manufacturing sector trend
10:00 ET 🇺🇸 LOW
Business Inventories (February)
Inventory-cycle reference
4/17Fri
08:30 ET 🇺🇸 MID
Housing Starts / Building Permits (March)
Leading indicator for housing
🇺🇸 HIGH
US Equity Markets Closed (Good Friday)
No trading on Good Friday
Previous day results (reported 4/15) / Remaining focus this week
MS BMO BEAT
Morgan Stanley
Financials
Reported Wed 4/15 Rev $20.6B vs $18.9B / EPS $3.43 vs $3.02
✓ Shares +5%; first-ever $20B quarterly revenue
BAC BMO BEAT
Bank of America
Financials
Reported Wed 4/15 Rev $30.4B vs $29.9B / EPS $1.11 vs $1.00
✓ Shares +2.5%; net income at ~20-year high
ASML BMO BEAT
ASML Holding
Semiconductor Equipment
Reported Wed 4/15 Rev €8.8B vs €8.5B / FY guidance raised
✓ FY outlook €34B → €36–40B
TSM BMO
Taiwan Semiconductor
Technology
Thu 4/16 Rev $35.2B EPS $2.47
Litmus test for AI infrastructure demand
NFLX AMC
Netflix
Entertainment
Thu 4/16 Rev $10.5B EPS $6.15
Streaming trends and ad-tier progress
UNH BMO
UnitedHealth
Health Care
Thu 4/16 Rev $109.5B EPS $7.25
Gauge for medical-cost trends
Fri 4/17 Good Friday
Closed
US equity markets closed
No major earnings